What Americans Hate The Most According to State
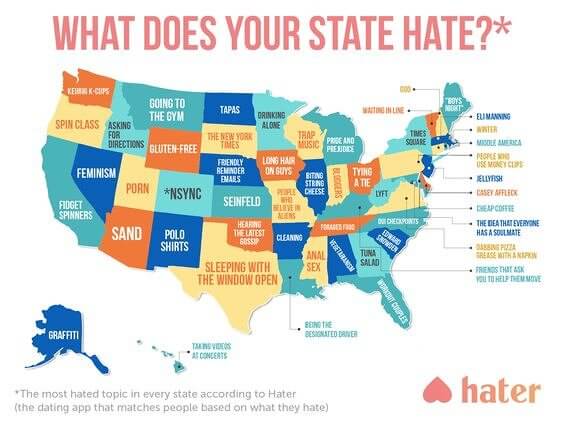
Here, we have a map created by a dating app called Hater, which pairs couples according to what they hate the most. Hater has compiled their data to reveal what each state, on average, hates the most. The results are as hysterical as they are weirdly niche. For instance, Virginia isn't a fab of people dabbing their pizza with a napkin, and Arizona detests sand, which must suck for them because I hear there's lots of sand in that state!
Interestingly, California appears to hate fidget spinners. While Oregon can't get on board with spin classes, Texas doesn't like sleeping with the window open. Ironically, New York hates Times Square.
Butter Vs. Olive Oil
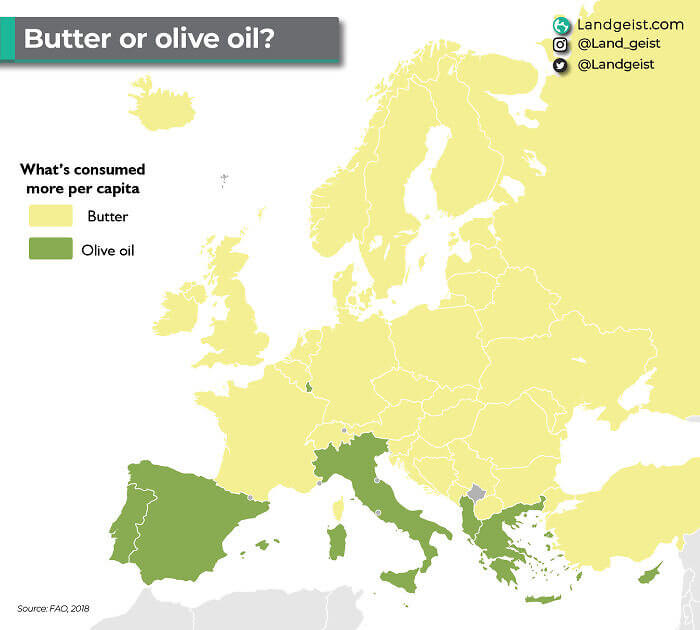
It is a bit of a stereotype that countries in southern Europe prefer olive oil. In contrast, the rest of Europe allegedly favors butter - and as we can see from this map, there seems to be a fair amount of truth to this. According to the Food and Agriculture Organization (FAO), this map highlights the countries that consume more butter or olive oil annually - according to the Food and Agriculture Organization (FAO). The yellow represents the countries that prefer butter.
Whereas the countries marked in green favor olive oil. As displayed on the map, we can see that most of southern Europe consumes more olive oil than butter except for Luxembourg!
Proportion of Young People Living With Their Parents
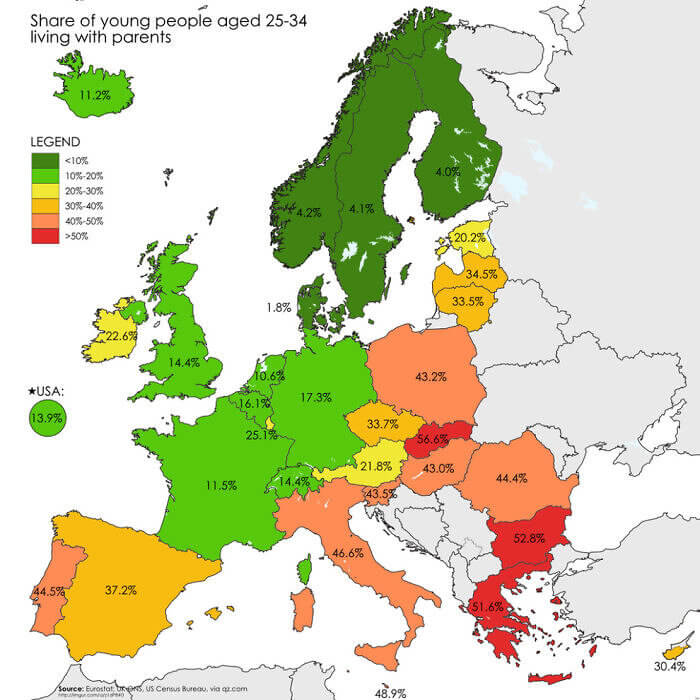
This map shows the proportion of young people aged between 25 and 34 living with their parents. The picture is absolutely fascinating. It really shows a difference in culture. For instance, in Italy, especially in more rural areas, it's typical for immediate and extended families to live altogether. For decades, this has been a cultural norm. So, it's not surprising that 46.6% of young people still live with their parents.
Whereas, in other cases, economics plays a huge factor - especially when you consider the price of property against the average salary of this demographic. A good example of this might be Ireland.
This One's a Bit Niche
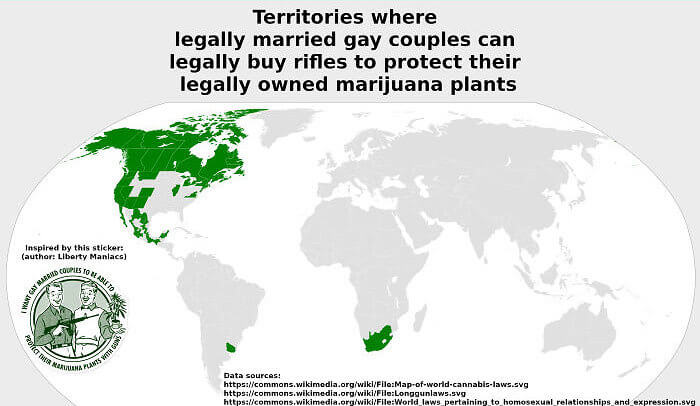
This map is a bit niche - to say the least. In this picture, someone has gone to the trouble to mark the places in the world where legally married gay couples can purchase guns to protect their marijuana crops. We're not sure why anyone would need this information - but hey! It's interesting stuff. As depicted by the green sections, this is most prevalent in northern America - particularly in the states of the north.
Interestingly, there also appear to be small regions in South America and Africa where legally married gay couples can buy rifles to protect their marijuana - who knew!
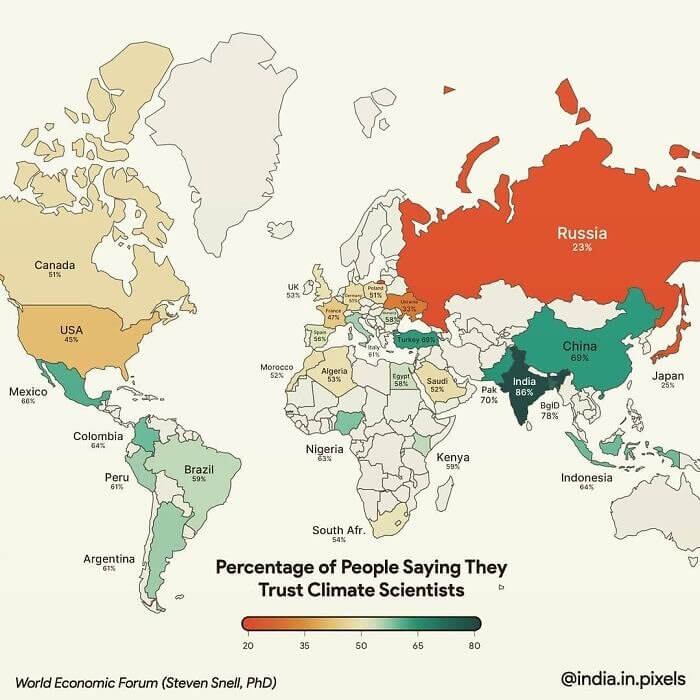
The Percentage Of People Who Trust Climate Scientists According to Country
This color-coded map indicates the percentage of people within each country that believe in climate change scientists. Our immediate thoughts are that we're surprised at how low these numbers are - just 45% of the USA and 47% in France. That's under half of the population of these vast countries. In contrast, the majority of India's population, at 86%, seems to believe in climate change, as does 69% of China.
More concerningly, though, less than a quarter of Russia's population believes in what climate change scientists have to say, followed closely by Japan at just 25%, and Ukraine at 33%!
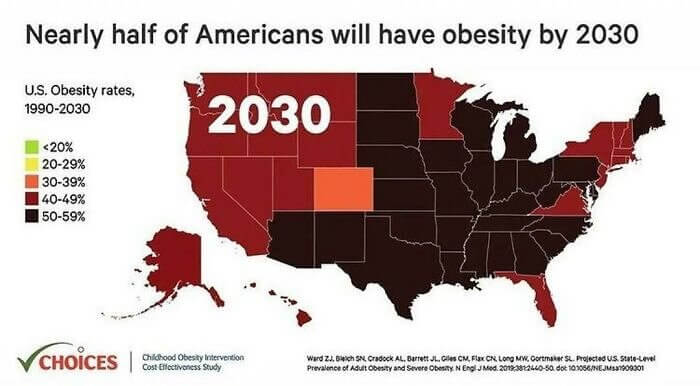
Nearly Half of Americans Will Suffer From Obesity in 2030
As we all know, obesity is becoming an increasing problem throughout the western world - and arguably, none more so than in the US. Unfortunately, experts predict that by 2030 nearly 50% of the US population will suffer from obesity. On top of that, at least 35% of adults will have a BMI (body mass index) of 30. For the uninitiated, this is the threshold defining obesity. Sadly, those who are overweight are more likely to suffer health complications and live shorter lives.
Not to mention, you'll incur higher healthcare expenses to boot! So, all in all, this image isn't just interesting; it's also a bit of a wake-up call - especially, as research also suggests that nearly one in four US adults will suffer “severe obesity!”
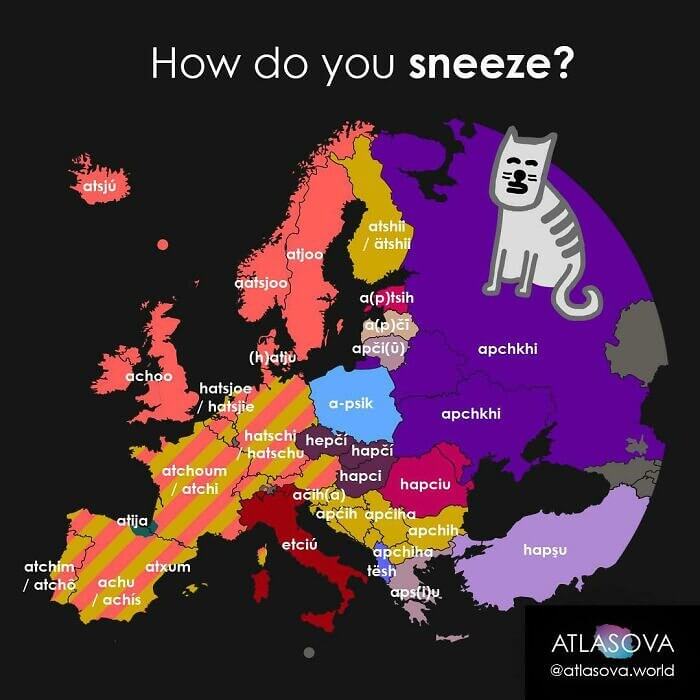
How Europeans Sneeze
Each culture has its own way of describing a sneeze - and this map helpfully shows us how Europeans sneeze according to the country they're from. For example, in the UK it's 'achoo,' whereas, in Spain, it's 'achu,' and in Italy, it's 'etciu.' Clearly, this varies somewhat across the map. But, why anyone would need this information, we're not sure. But we're glad they've compiled it because it certainly brought a smile to our faces!
However, we have to ask, why is there a cat in the top right-hand corner of this map? What does this have to do with sneezing?
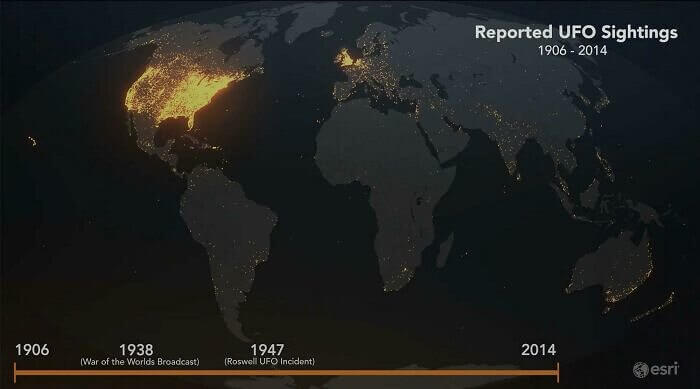
Reported UFO Sightings
This map highlights reported UFO sightings from over the last 115 years. To understand the significance of this map, we've sourced a UFO definition from Britannica. For the uninitiated, UFO stands for an 'unidentified flying object (UFO).' However, such UFOs have also been referred to as 'flying saucers.' That said, a UFO can be any 'aerial object or optical phenomenon not readily identifiable to the observer.' And as we can see, people have been spotting UFOs for over a century.
Although this isn't necessarily evidence of alien activity, it tells us that there's plenty of ariel phenomenon that isn't readily explained - particularly in northern America and the UK.
Us States That on Average Prefer Cats to Dogs
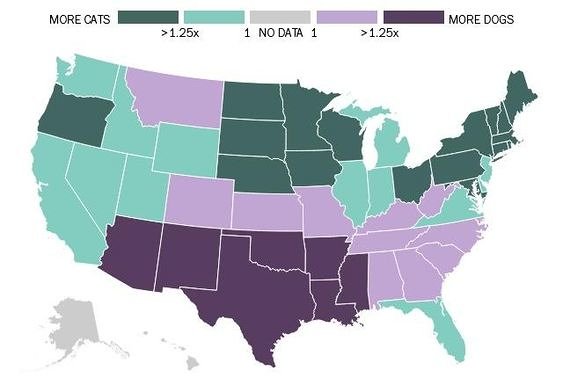
Dog person or cat person? It's an age-old question that we've all been asked at some point or another. But, now, thanks to the American Veterinary Association, there's a map that enables us to see at a glance the average preference, according to state. The purple states indicate where dogs are in the lead, whereas the greenish states are where cats are held supreme. Interestingly, the majority of the South are dog-lovers.
Interestingly, Arkansas was the most dog-friendly state - apparently, here, the number of people who prefer dogs outnumbered cats-lovers 1.35-to-1. In contrast, Massachusetts scored 1.87 cat votes for every dog!
The Green Marks Where No-One Lives in New Zealand
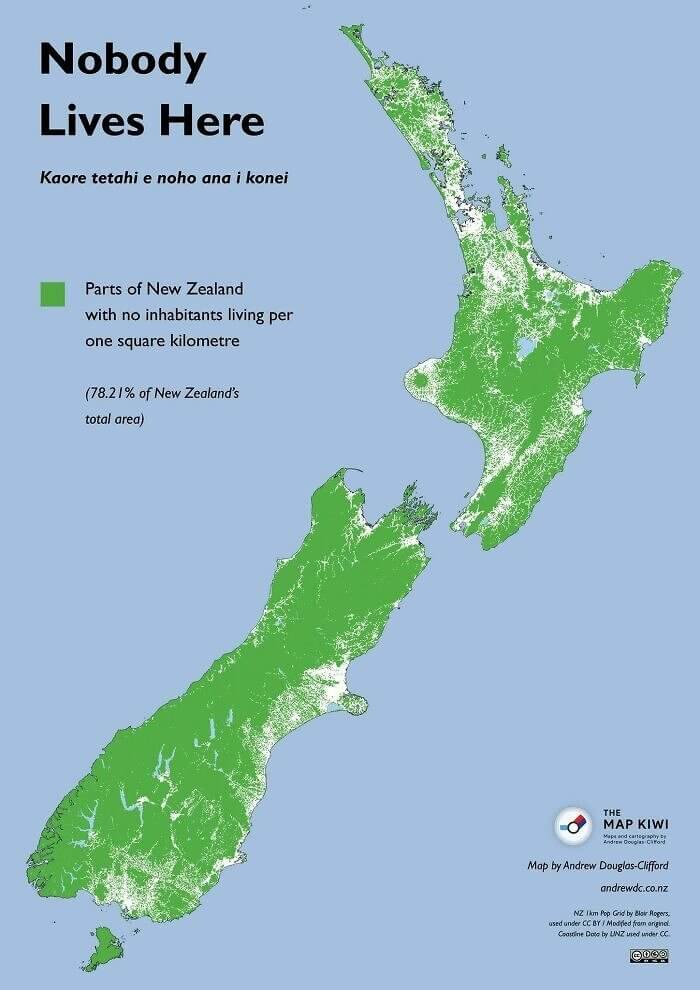
Amazingly, the green parts of this map mark the areas of New Zealand where no one lives - more specifically, these sections showcase a population density of zero people per kilometer, which equates to just over 78% of New Zealand's land. In total, New Zealand has a population of roughly 4.6 million people spread out over 268,021 km², which, compared to other countries like the UK and Japan, is incredibly sparse.
Just think about how much space this leaves for wildlife - no wonder New Zealand can house around 26.16 million sheep! That's over five times the size of the country's human population!
Italy's Wolf Distribution Since 1900
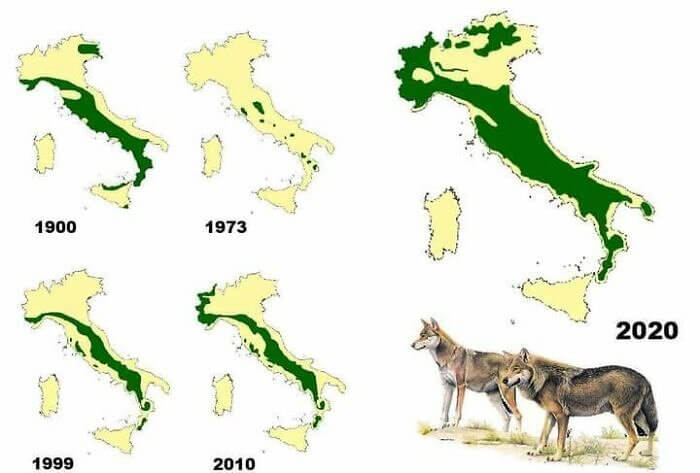
This map is incredibly insightful - we didn't even know Italy had wolves in the wild. But, as we can see at the beginning of the 1900s, wolves were widespread across Italy - particularly across the mountainous areas. Then, by the 1970s, the wolves were persecuted until they were completely eradicated from the Alps and Sicily. This triggered efforts in the 1970s/beginning of the 1980s to recover Italy's wolves.
As we can see from these maps, these efforts weren't in vain. On the contrary, the wolf population has gone from strength to strength. So much so that in 2020 there are now even more Italian wolves than there were in 1900!
Largest Generation Per US County
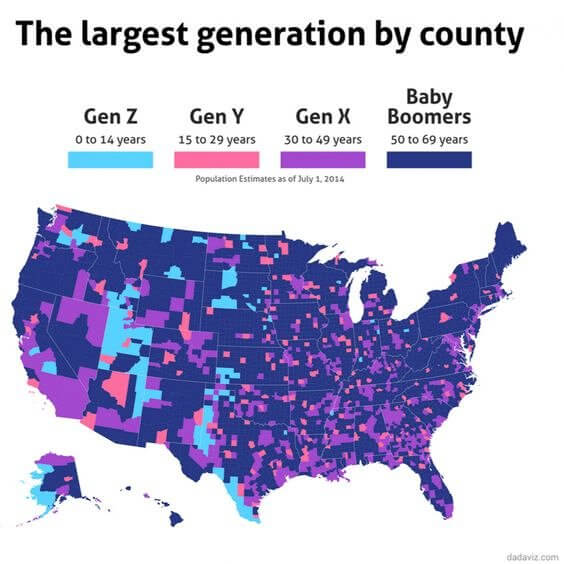
We have a brilliant visual of the largest generation within each US county's population on this map. As we can see, the majority of the map seems to be dominated by Baby Boomers (navy blue) with a small smattering of Gen Z (light blue). Of all the states, Florida boasts the largest population of baby boomers. However, Arizona, Maine, Pennsylvania, and West Virginia are also incredibly popular among older Americans.
In contrast, Gen X's look like they've sought employment from bigger cities - they seem to have a more prominent presence in New York, Minnesota, Illinois, Texas, Colorado, and the West Coast.
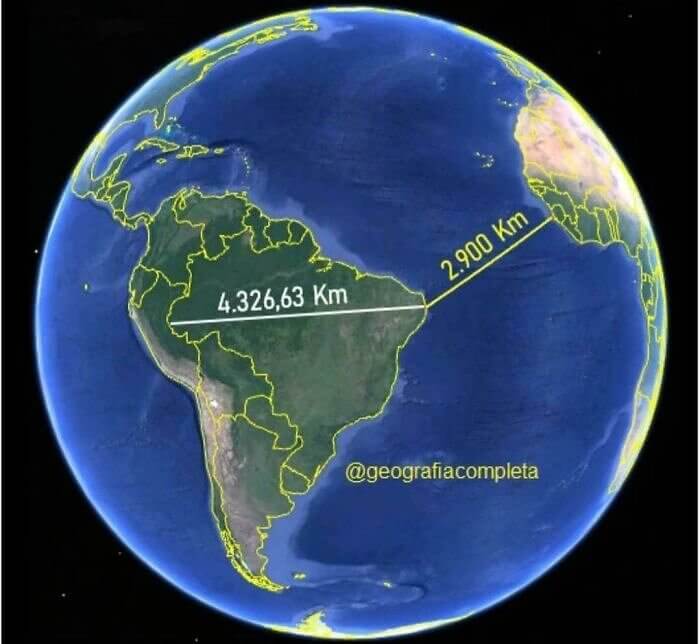
Brazil's Easternmost Point Is Closer To Africa Than Its Westernmost Point
This map clearly illustrates that Brazil's easternmost point is significantly closer to Africa than its westernmost point. At Brazil's broadest point, the land boasts a width of 4.326,63 kilometers. However, Brazil's easternmost point is only 2.900 kilometers from Africa. In other words, the distance between Brazil to Africa is much shorter than the width of Brazil. This just goes to show how huge Brazil is! This is an excellent example of how the continent's size and proximity are often distorted thanks to how our maps are drawn.
For the same reason, many people don't realize that Russia is as close to Alaska. The moral of the story: Mapping a spherical globe on a flat surface is a tall order!
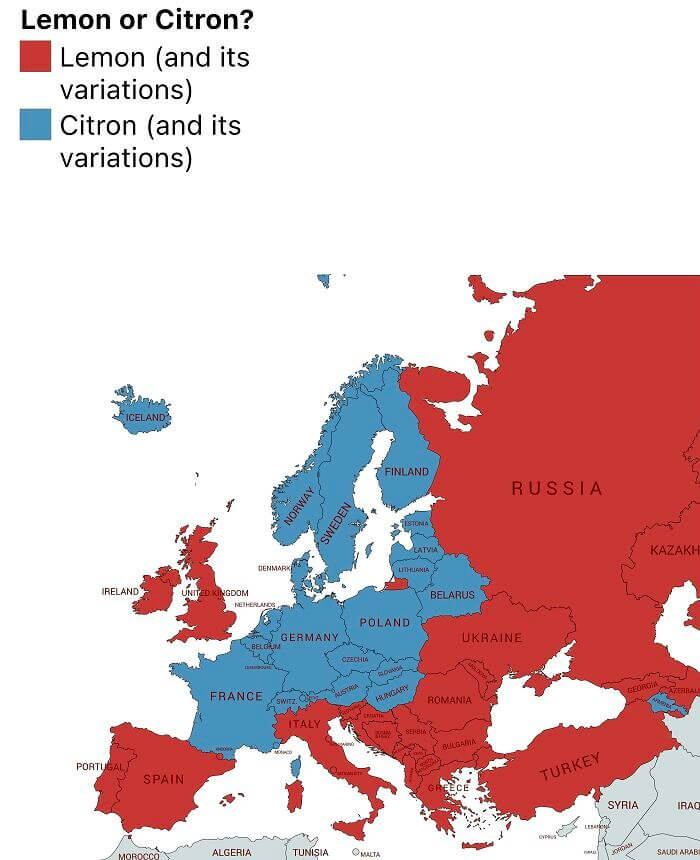
Language Using 'Lemon' or 'Citron'
Varying European languages use different words to describe a lemon. Here in this map, we can see which countries use which term. The countries marked in red tend to use the word 'lemon.'' In contrast, the countries in blue typically use the word 'citron.' If you're from the UK, it's 'lemon' whereas, elsewhere in Europe like Russia, Ukraine, Romania, Italy, and Spain - to name a few, plump for 'citron.'
In contrast, other countries like Norway, Sweden, Poland, and France prefer to use 'lemon' - who knew? But, this begs the question of why Italy's limoncello is spelled the way it is!
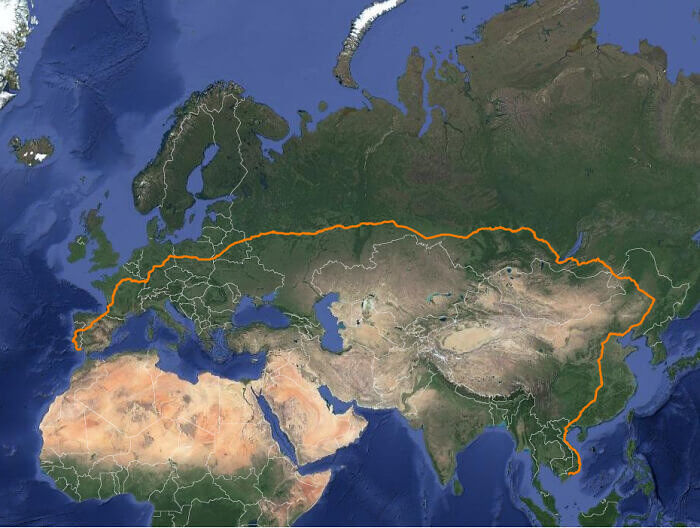
The Longest Possible Train Ride
This picture shows the longest possible train (or bus) journey globally - starting from Porto to Coimbra, Portugal, and ending in Singapore. This route covers around 16,000 kilometers. These two countries sit at opposite ends on the world map - so it's no wonder this journey takes an astonishing three weeks to complete. However, the views you'll experience looking out of the train window are reportedly phenomenal - you get to experience the world without ever leaving your seat!
The penultimate stop is Bangkok - and from there, there are two ways to get to Singapore. Travelers can either take a train to Malaysia and then another to Singapore. Alternatively, for those looking for a more luxurious experience, there's the Eastern & Oriental Express that takes passengers straight to Singapore.
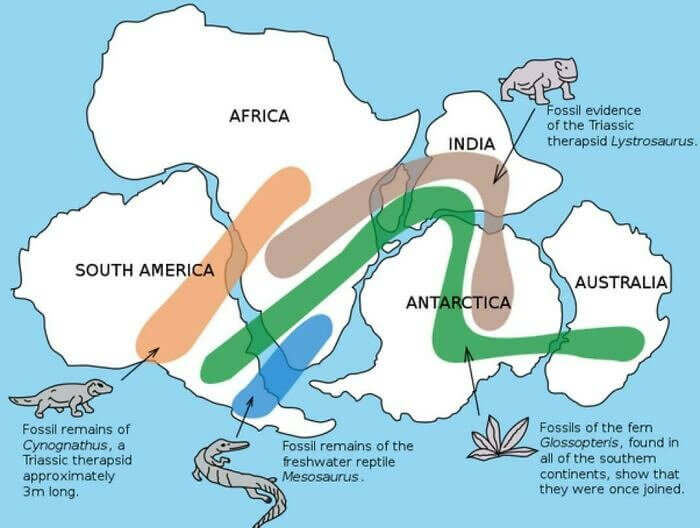
Fossil Evidence Provides Evidence for Pangaea
As this map showcases, fossils of similar plants and animals around the same age have been discovered across different continents. Scientists say that this is viable evidence that all of the world's continents were once joined - a phenomenon often referred to as 'Pangaea.' For instance, the Mesosaurus (a freshwater reptile) have been located in western Africa and Brazil. Likewise, the fossils of land reptile Lystrosaurus have been found in Africa, India, and Antarctica.
The same goes for the Cynognathus, best likened to today's wolf. Fossils of this mammal have been found in both South America and Africa. Similarly, fossils of the glossopteris, a fern-like plant, have been seen across all of the southern continents.
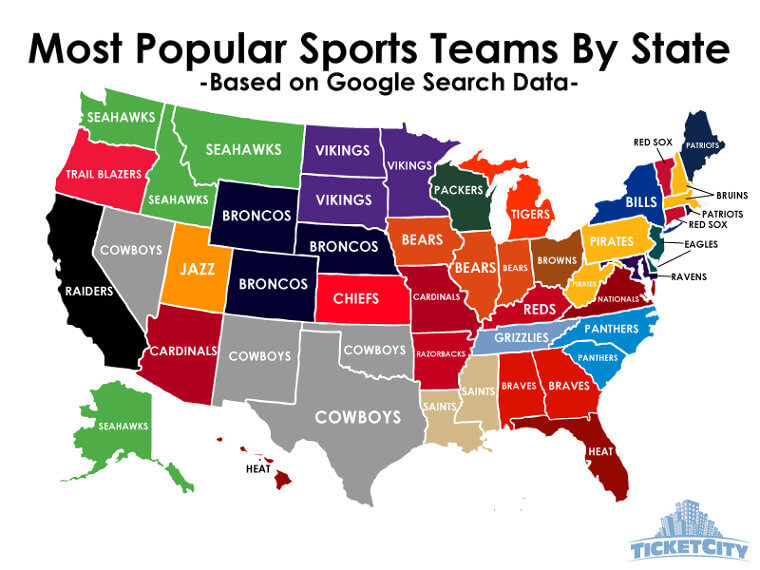
Sports Team Popularity According to State
Here is a map that displays the US's favorite sports teams according to state. The data fuelling this map is based on Google's search data. As a result, the results may be a surprise. Many have commented that not only are the Cowboys a favorite in Texas, but they also seem to have the majority of the southwest enthralled with them too- Go, Cowboys! In contrast, Jazz only appears to have one state locked down.
Like the Cowboys, it looks like the Vikings, Seahawks, and Bears have also earned themselves some cross-state popularity, with each of these teams being rated the most popular across three states apiece.
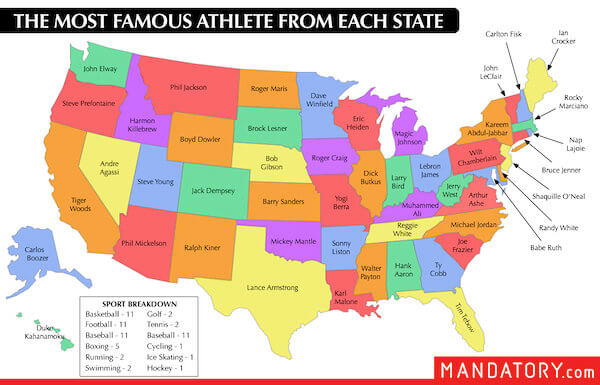
The Most Famous Athlete According to US State
Here we have another colorful map. However, this one depicts the most famous athletes spanning each US state. There are a few unsurprising names here. For example, we can see Tiger Woods, a golfing legend, hailing from California, taking the top spot for this state. However, some states may wish to distance themselves from their most famous athlete. For instance, once heralded an Olympic legend, Texas's Lance Armstrong still hasn't fully recovered from the doping scandal.
Whereas, over in Indiana, Larry bird takes the crown for the state's most famous athlete. This isn't surprising when we remember Larry Bird's years playing for Indiana State University before joining the NBA.
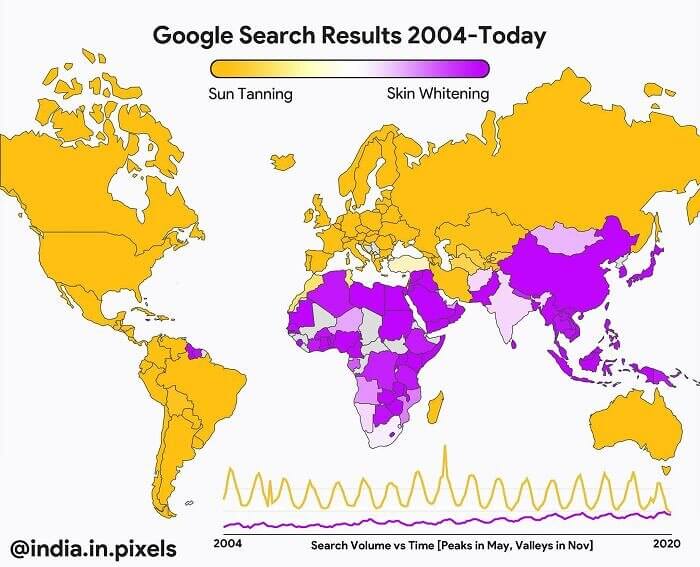
Sun Tanning Vs. Skin Whitening
This map shows the geographic distribution of people searching for 'sun tanning' and 'skin whitening' on Google. This trend has been monitored between 2004 and 2020. For us, it's fascinating to see that the majority of Western countries are looking to tan themselves. In contrast, most of Africa seems to be Googling skin whitening. But, wouldn't it be nice if we could all just be happy with the looks we were gifted with?
Alas, it seems to be human nature to want what we can't have! On a separate note, it looks like New Zealand has been missed from this map for whatever reason!
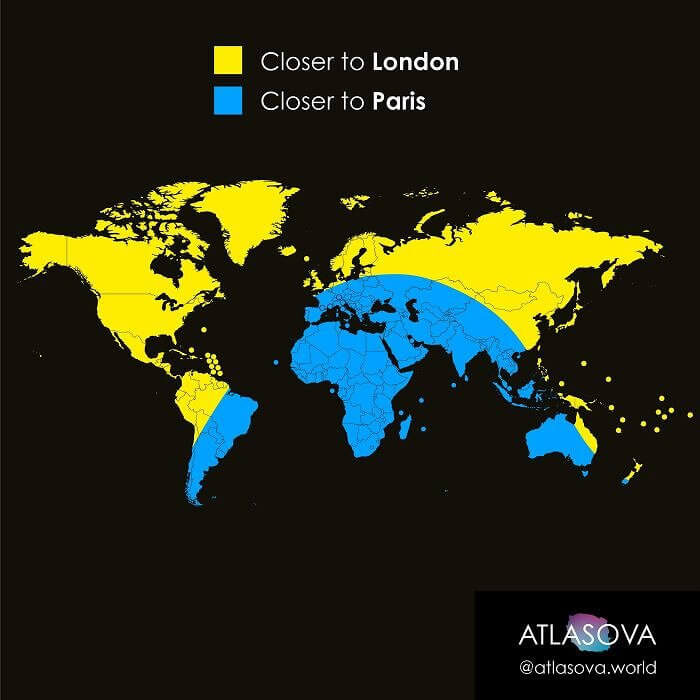
Nearer Paris Or London?
This map provides an incredible demonstration of how complex mapping a spherical planet onto a flat surface is. Thanks to the world's roundness and our attempts at mapping the globe, gauging distance between regions is historically quite tricky. However, Atlasova has done a fantastic job. More specifically, this map highlights which countries are closer to London or Paris. Here, we see that the majority of nations are actually closer to London than Paris.
These results may be a surprise to some of our readers. But, most remarkably, the fact that some of France is actually closer to London than Paris is somewhat of an eye-opener!
European Countries Yet to Experience Temperatures Above 35 Degrees Celsius
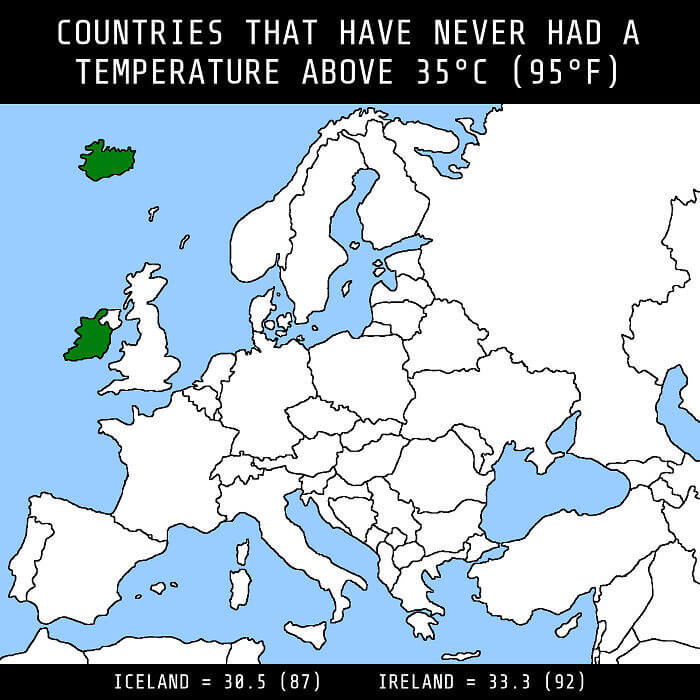
When it comes to European countries yet to experience sweltering temperatures, there are only two: Iceland and Ireland. Astonishingly, Iceland has never risen higher than 30.5 degrees celsius (87 degrees Fahrenheit). In contrast, temperatures in Ireland have never crept higher than 33.3 degrees Celsius (92 degrees Fahrenheit). This is especially interesting when you consider that back in 1977, the hottest temperature to be recorded in Europe was 48.8 degrees Celsius in Athens.
Needless to say, for those looking for exceptionally sunny holiday destinations Iceland and Ireland should be at the bottom of the list. After all, Ireland only averages ten degrees Celcius/ 50 degrees Fahrenheit - chilly!
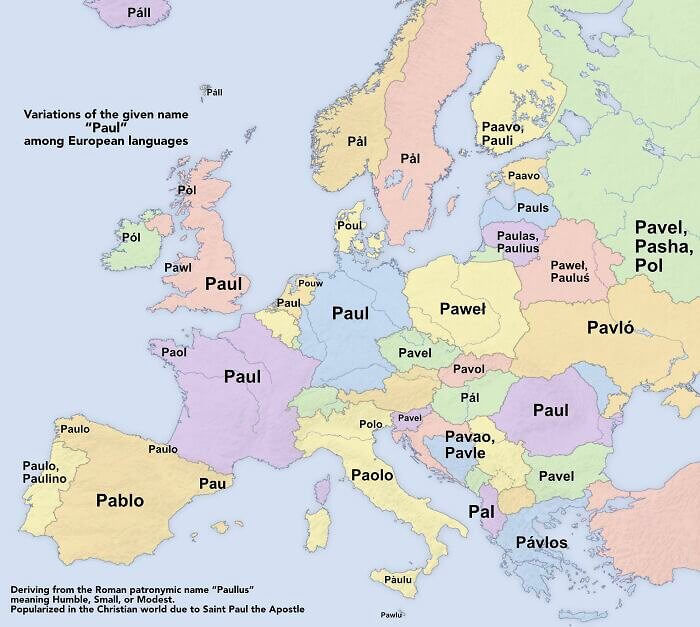
Variations of The Name 'Paul' According to European Country
We found this map simply fascinating. The name 'Paul' is a popular name with biblical origins - so it's no wonder it's used across Europe. But more interestingly, how the name 'Paul' is pronounced fluctuates somewhat, depending on the country, language spoken, and dialect adopted. As we can see, this is excellently showcased on this map. The name Paul spans from 'Paolo' in Italy, to 'Pablo' in Spain, to 'Pawl' in Wales.
Interestingly, this same map says tell us that the name 'Paul' means 'humble, small, or modest,' and suggests that the modern-day name 'Paul' derives from the Roman patronymic name 'Paullus.'
Netherlands Reclaims Land
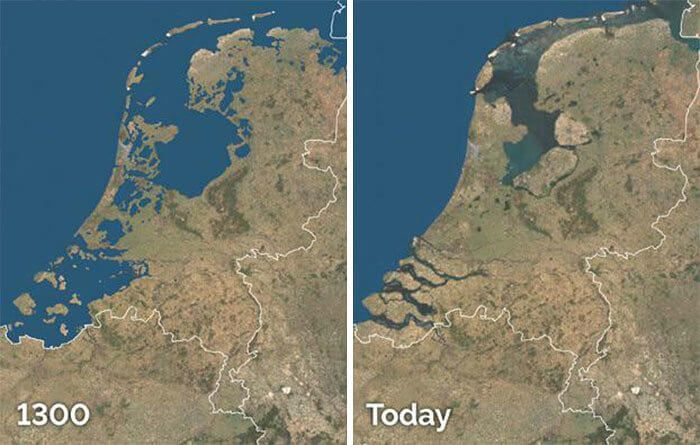
Here we see pictured two maps in stark contrast to one another - one shows what the land of the Netherlands looks like today, compared to what it looked like back in 1300. As you can see, over time, the country has reclaimed a lot of landmasses from neighboring seas and lakes - around 17%, to be precise. Incredible, right? However, this isn't a natural process. Over the centuries, the Dutch have worked tirelessly to push back the water by building dikes and creating polders.
Then, once these dikes were built, the people of the Netherlands created canals and pumps to help drain the water from the land and keep it dry. Interestingly, these first attempts date back to the 1200s, where windmills were used to pump excess water off the soil. Fast forward to today, and windmills remain iconic throughout the Netherlands.
Italy's Rivers
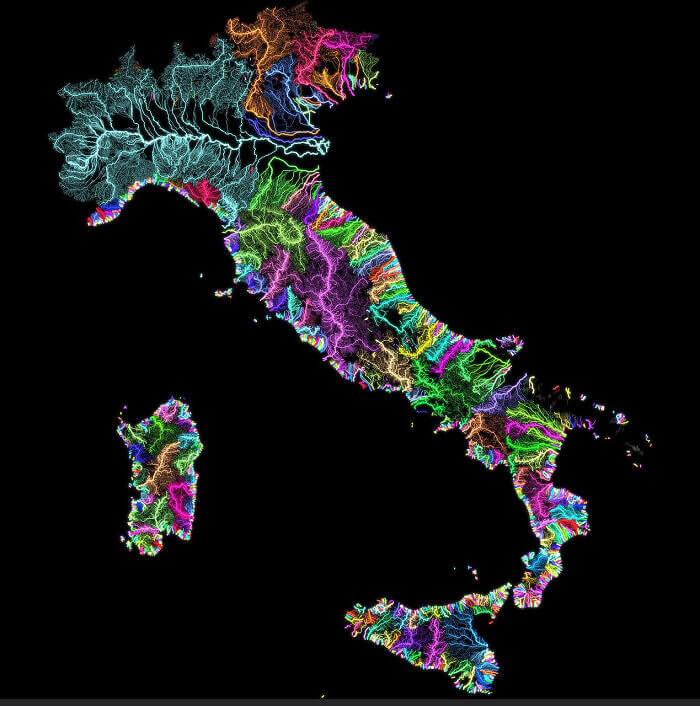
This stunning map marks Italy's river basins. Historically, Italy's rivers have always provided the country with its primary water sources. Some of Italy's largest rivers drain into the Adriatic Sea. These include the Po, Adige, Reno, Savio, and Isonzo. Italy's longest river at 405 miles is the Po and flows through Turin and Ferrara. The Adige is also pretty long at 250 miles. Then at 252 miles long, is the river Tiber.
When we look at this map, we see Italy's rivers in all their glory. We love how they intricately connect with one another and the surrounding seas. It's absolutely breathtaking!
What Europe Would Look Like If Sea Levels Rose 100m
If sea levels rose a whopping 100 meters, Europe would look very different indeed - as is so excellently displayed in this fascinating map. It's interesting that the UK would be separated into tons of smaller islands. Unfortunately, however, Denmark appears to have drawn the short straw. In fact, in this scenario, it seems to have been entirely engulfed by the sea.
The following countries would also seem to be impacted: Ireland, Netherland, Belgium, and Monaco. That's as well as large parts of Italy, Greece, the Baltics, Germany, Poland, Romania, and France.
Prisoners Per 100,000 People In Europe
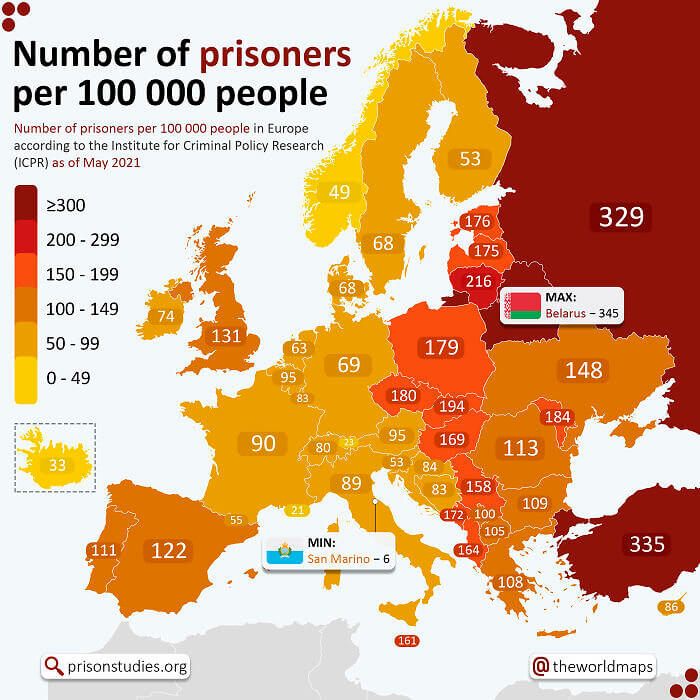
Here in this map, we can clearly see the number of those imprisoned per 100,000 people across different European countries. This information was reportedly collected from the Institute of Criminal Policy Research and is accurate as of May 2021. Interestingly, the country housing the most prisoners per 100,000 people is Belarus, at 345. In contrast, the country with the fewest prisoners per 100,000 is San Marino. As of January 2020, San Marino only had two prisoners.
Interestingly, most criminals from San Marino are sentenced to do their time in Italian prisons. It was also interesting that the country with the second-highest prison population is Turkey - who knew?
Hats Of Europe
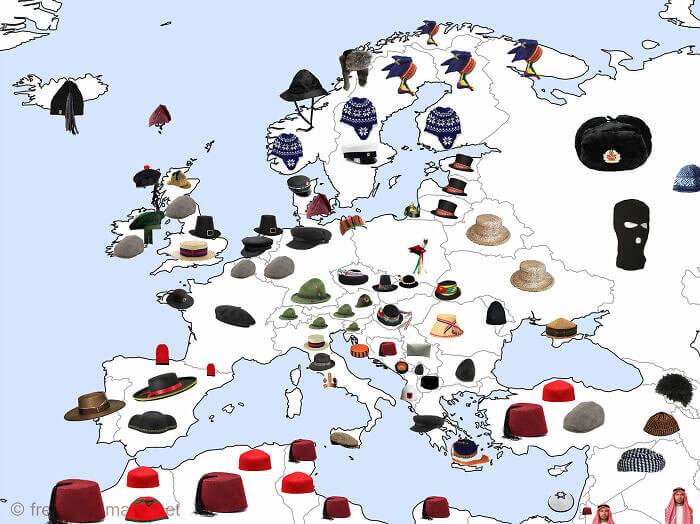
This map literally made us laugh out loud - we've never seen a map that plots out traditional men's hats across Europe. However, plenty of people on Reddit seem to disagree with some of the hats assigned to various countries. With one user commenting: 'As a hat expert, I can tell you, this map is utter BS. Almost every single village in Europe has their own kind of traditional hat.'
Whereas, another commenter said: 'The white cap on Sweden should be on Finland too. It's a traditional lukio/gymnasium graduation hat.' Another commenter agreed and said: 'I don't get why Sweden got the white cap; that's a Norwegian tradition too (although different colors).'
Percentage of Indian Households With Access to a Toilet
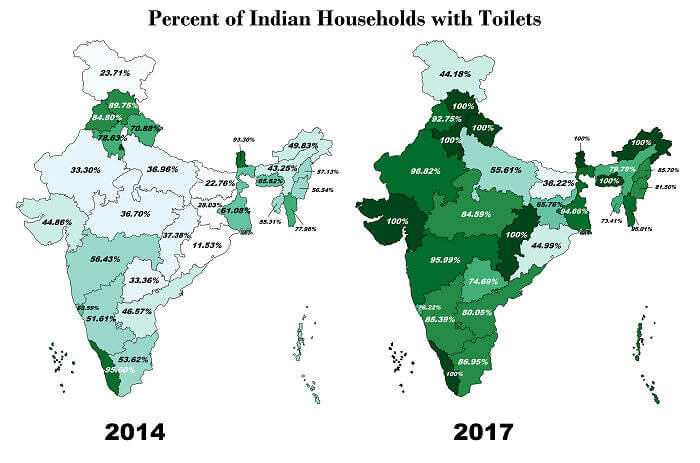
This map was eye-opening - to say the least. Having a toilet in your own home just seems like a given, which really goes to show the privilege the majority of the western world enjoys. But, as is shown in the picture, the percentage of Indian households with toilet access has skyrocketed in just three years. In 2014, in one Indian region, only 11.53% of households had a toilet! Whereas, in 2017, that same region enjoyed 44.99% toilet access.
Although there's still a long way to go, it's safe to say that this is tremendous progress. In fact, in the 2017 map, there are a few regions with 100% access. In contrast with the 2014 map, none of the areas scored 100%.
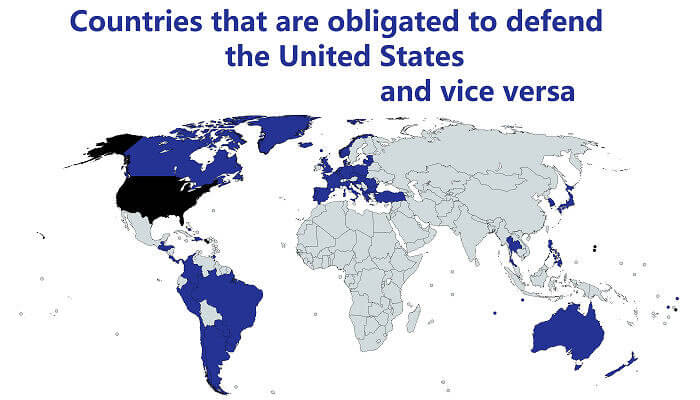
Countries Obligated to Defend the US
What we're looking at here seems to be an outdated map of Nato. The countries highlighted in blue were all at some point obligated to defend the US and vice versa. Fun fact: NATO stands for the 'North Atlantic Treaty Organization.' This was established by the US back in 1949 after world war two, alongside Canada, and a hand full of Western European nations. The idea behind the treaty was to establish collective security against the Soviet Union.
Today, the following member states are a part of NATO: 'Albania, Belgium, Bulgaria, Canada, Croatia, the Czech Republic, Denmark, Estonia, France, Germany, Greece, Hungary, Iceland, Italy, Latvia, Lithuania, Luxembourg, Montenegro, Netherlands, North Macedonia, Norway, Poland, Portugal, Romania, Slovakia, Slovenia, Spain, Turkey, the UK, and the US.'
Jupiter Vs The US
Here is an incredible image of northern America against Jupiter. With a 43,441 mile radius, Jupiter is well-renowned for its humungous size. But this direct comparison only emphasizes just how giant the planet is. Again, we can thank John Brady for his incredible work here. As we can see, although Jupiter's 'Great Red Spot' is fading, it's still way broader than North America - which again only highlights Jupiter's magnitude further.
We found it incredibly humbling to remember just how small the earth is compared to what's out there. We truly are part of something so much bigger! #sorryforgettingdeep
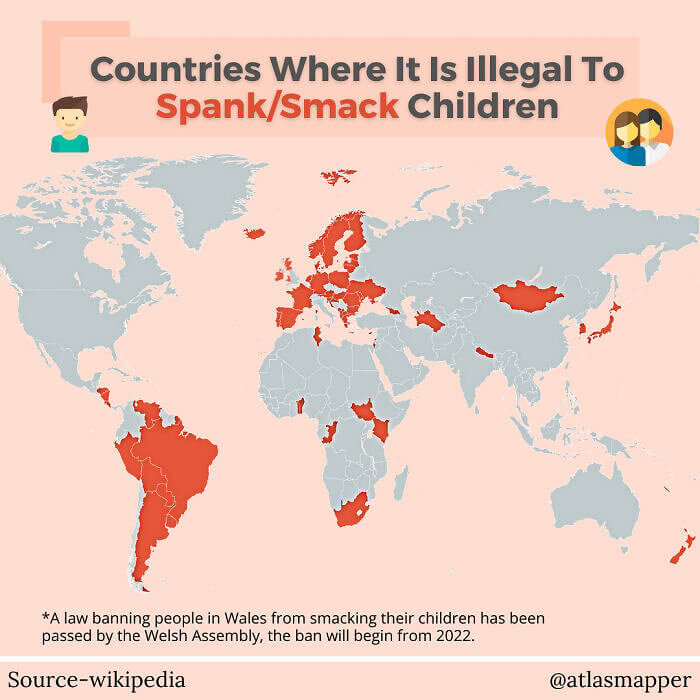
Countries Where It's Illegal to Spank Children
It's safe to say, many of us wish this was illegal worldwide! There have got to be better solutions to parenting kids than slapping them in this day and age, right? Here in this map, the countries marked in red have made it illegal to spank/smack children. From this map, we can see southern America is really blazing the trail here, as is a fair amount of Europe, which is great to see - especially Scandanavia!
But, what's also uplifting is that as we speak, other governments are turning their attention to this issue, as is so aptly communicated in the image's footnote. From 2022 a ban will come into effect in Wales too!
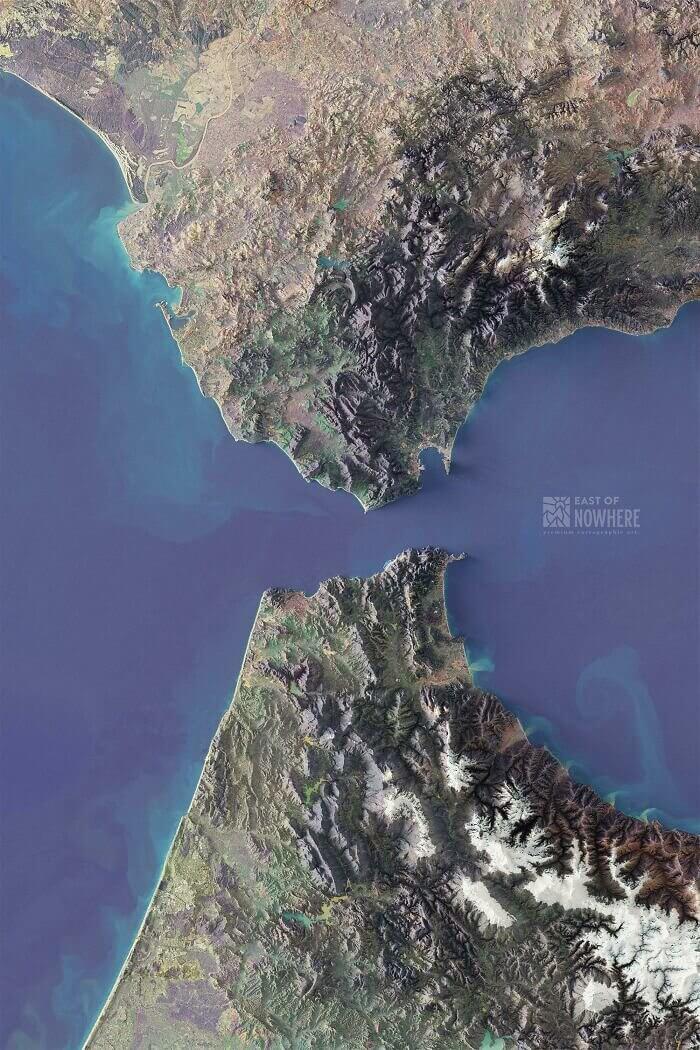
The Strait Of Gibraltar
Pictured here is the Strait of Gibraltar, located between southern Spain and northwest Africa. This connects the Mediterranean Sea with the Atlantic Ocean. It measures 58 kilometers long and 13 kilometers wide. Interestingly, the Strait of Gibraltar is the only natural gap in the topographic boundaries separating the Mediterranean Sea from the rest of the globe's oceans. On top of that, the straits of Gibraltar span the mythical Pillars of Hercules.
The Rock of Gibraltar marks the European pillar, while the opposite one has never been decided upon. Traditionally, the second pillars are believed to be two huge mountains Monte Hacho (in Spain) and Jebel Musa (Morocco).
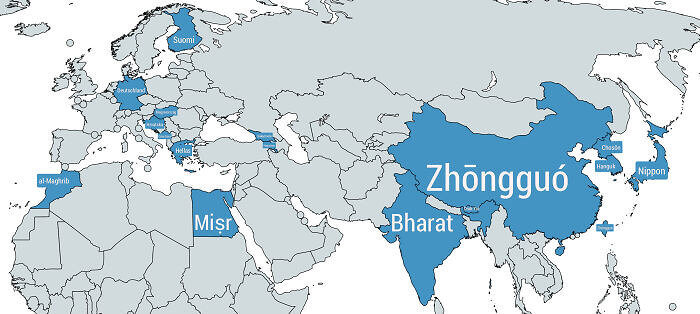
Countries Whose Local Names Are Different From Their English Ones
Interestingly, the English names we've given to various countries around the world aren't always the same as the local name adopted by the nationals of said country. In this map, we can see a few of these countries as well as their local names. For instance, take a look at 'Egypt's,' 'Misr' this one is nice and short - which makes us wonder why anyone would re-name it anything else?
In contrast, China's 'Zhongguo' might be a tongue twister for Americans and Brits - We wouldn't even know where to begin with pronouncing this name!
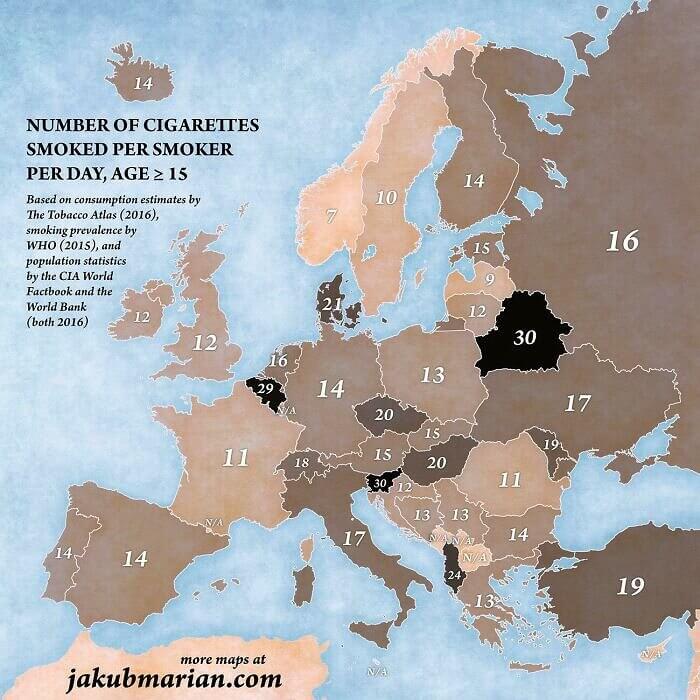
The Average Number Of Daily Cigarettes Smoked Per Person In European Countries
This map is created based on research conducted by The Tobacco Atlas, where an estimation of the average number of cigarettes smoked by the average person aged 15 and over in 2016 was made. The map's creator (Jakub Marian) also extracted data from WHO the sex ratio (The World Factbook, 2016) and the World Bank's data (2016) on the male and female population. He used all of this information to determine the average number of cigarettes smoked by smokers.
That's pretty impressive research and maths skills, right? Not to mention, the results make for interesting discussion. For example, who knew that French smokers smoked an average of 11 cigarettes a day? Or Brits 12? Or, the Italians 17?
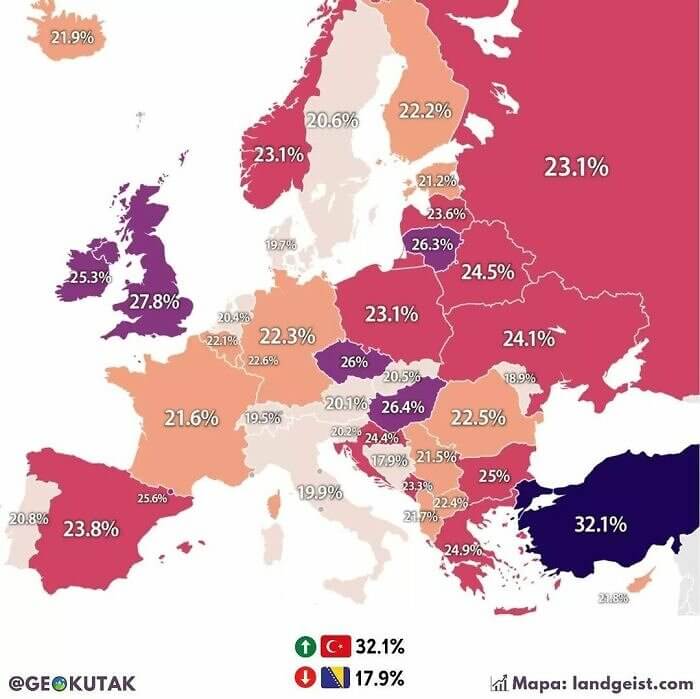
Percentage Of Obese People Per European Country
This map provides an excellent visual of European adult obesity rates. Interestingly, the three countries with the highest rates of obesity are as follows: Turkey (32.1%), Malta (28.9%), and the UK (27.8%). In contrast, the countries with the lowest obesity rates were Bosnia and Herzegovina (17.9%), Moldova (18.9%), Switzerland (19.5%). Interestingly, Bosnia, Moldova, Switzerland, Denmark, and Italy, are the only countries where less than 20% of its adult population are obese.
Although visually, there isn't a robust geographic pattern. However, there are a few geography-based trends worth noting. For example, mainland Western Europe seems to boast some of the lowest obesity rates.
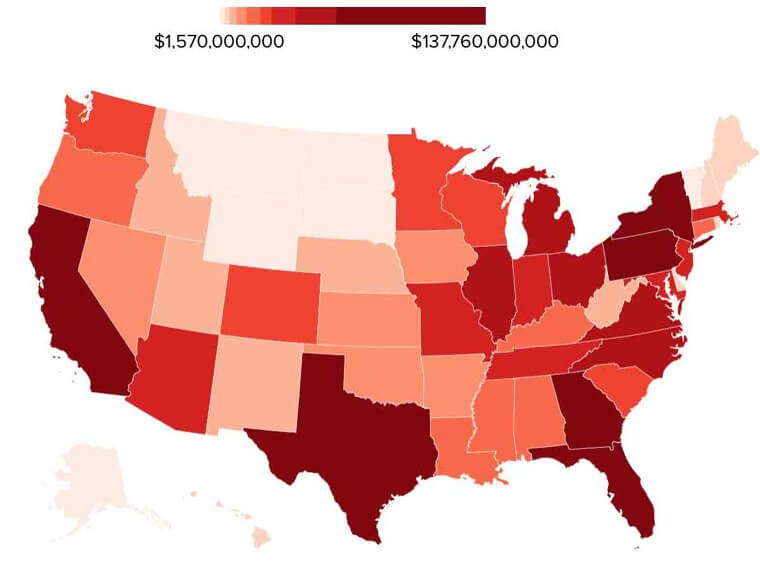
Average Student Debt by US State
Collectively, it's estimated that US students owe an astounding $1.4 trillion in federal student loan debt! Needless to say, college graduates are facing all manner of stressors. Not least finding a job to pay off the crippling debt. Here, in this map, we get a feel for the US state's average amount of debt the average student is facing. As we can see, some of the states where students are facing the most debt include Washington.
Astonishingly, students from Washington suffer the nation’s highest average federal student loan debt at $55,077 per borrower. Maryland is also pretty steep at $43,219, and Georgia $41,843. In contrast, North Dakota is one of the cheapest, at an eye-watering $29,446.
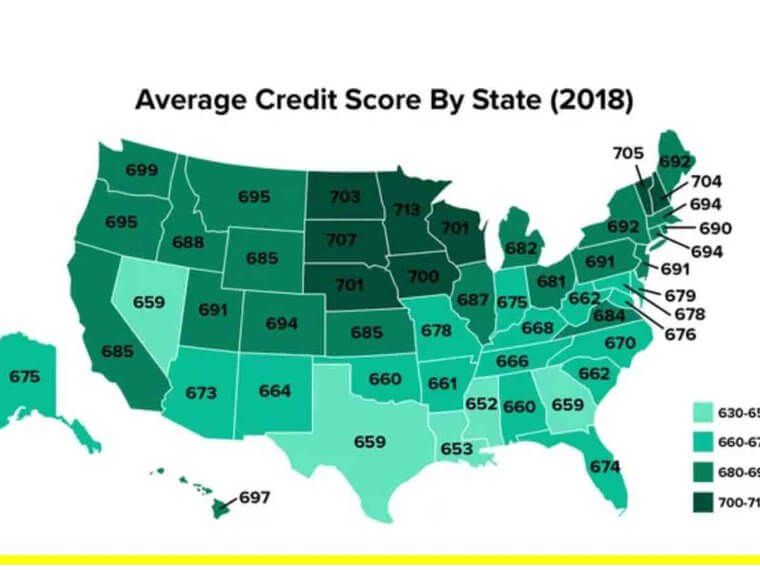
Average Credit Score by US State
Here in this map, we can see data collected by Experian, the famous consumer credit reporting agency. This well-renowned company has gathered data relating to credit scores across all 50 US states and calculated the average for each state. As we can see, Minnesota, South Dakota, Vermont, New Hampshire, and Massachusetts were amongst the highest-scoring states. Interestingly, a score of 800 or above is considered an excellent credit score, but no state averaged that.
Instead, most consumers accrue a credit score somewhere between 600 and 750, and amazingly no state scored lower than 600! That said, the national average score is 710 - but most states didn't achieve this as an average.
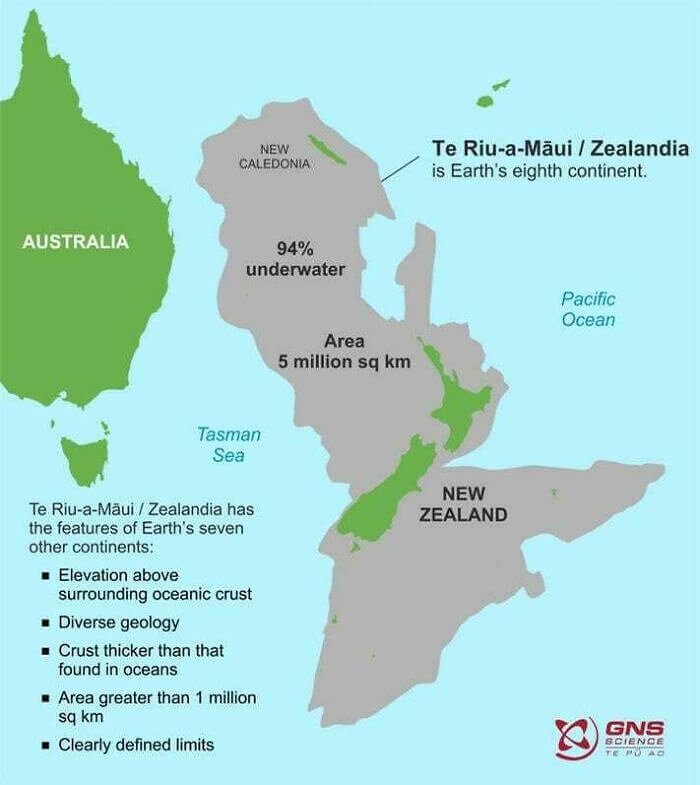
Zealandia
This map depicts Zealandia, the eighth continent that's 94% submerged. Zealandia is located in the southwest Pacific Ocean and is made up entirely of continental crust. As per the annotations on this map, Zealandia shares the same characteristics as the seven traditional continents. Most notably, altitude above the neighboring oceanic crust, varied geology, a deeper crust than that found in oceans, explicitly defined limits, and an area bigger than one million square kilometers.
Interestingly, recent reports suggest that parts of Zealandia are roughly one billion years old - this is approximately double the age geologists initially thought, which only adds to the argument that Zealandia should be classified as a continent.
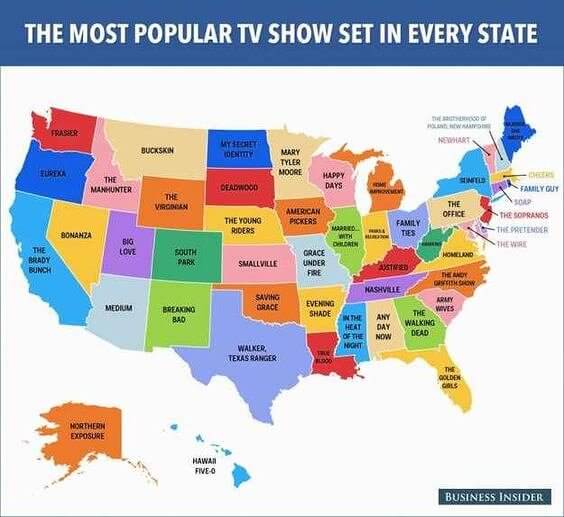
The Most Popular TV Show According to Each US State
Here is a map that clearly shows us America's favorite TV shows according to state. We weren't too surprised by some of these, not least that New Mexico is a huge fan of Breaking Bad. As the TV show skyrocketed in popularity, it brought a massive influx of tourism to the state. However, there were a few favorites that shocked us. For instance, we thought it was a given that Dallas would be a bigger hit in Texas.
Instead, Walker, Texas Ranger, took the lead as the state's favorite. It just goes to show that you can't make assumptions about anything! It's also worth bearing in mind that this data only spans traditional television series' - not reality TV shows.

